Show code
knitr::include_graphics("~/Documents/GitHub/Ousmanerabi.github.io/images/bootstrap.png")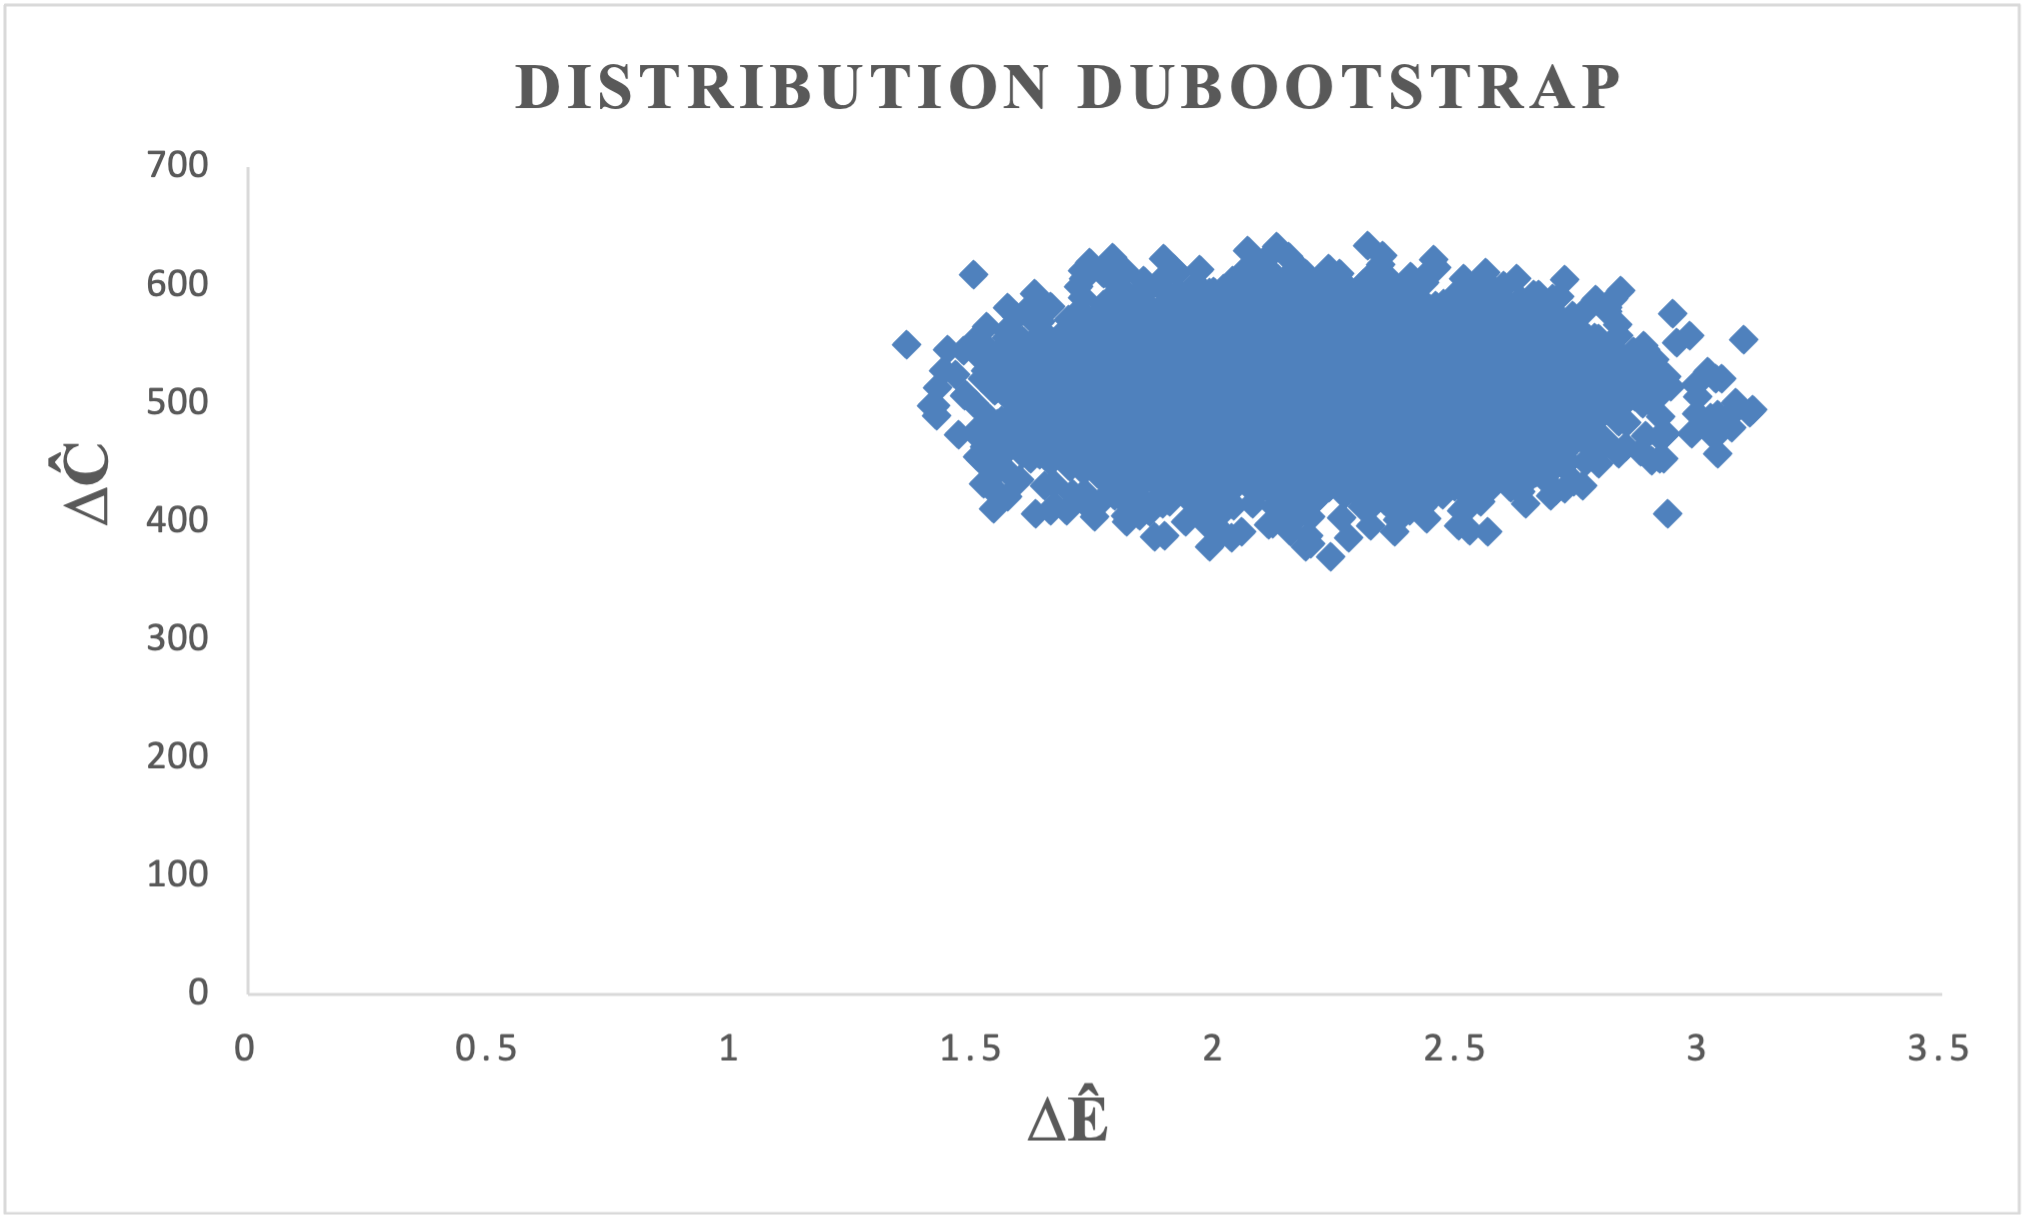
biostatistics, epidemiology, health data science, SAS programming, CDISC standards, clinical trials, real-world evidence
In the Aquitaine region of France, as part of the Nutrition, Prevention, and Child Health Program—the regional extension of the National Nutrition and Health Program (PNNS) for children and adolescents—a harmonized screening and management approach for pediatric overweight and obesity was developed. This initiative led to the creation of the REPPOP network (Réseau de Prévention et de Prise en charge de l’Obésité Pédiatrique), an integrated and multidisciplinary care system operating in the Gironde area.
The REPPOP network connects community physicians, hospital practitioners, and public health professionals (including school doctors, nurses, and maternal and child health services) with a central coordination team. Children enrolled in REPPOP receive a two-year multidisciplinary follow-up, including regular medical visits and, when appropriate, nutritional and psychological counseling.
At admission, two inclusion consultations are conducted by the referring REPPOP physician:
Inclusion visit 1: to exclude organic causes of obesity and detect complications.
Inclusion visit 2: to establish an educational and behavioral management plan.
The attending physician and family then define personalized, realistic objectives for the child and determine the most suitable care pathway.
Despite the broad implementation of this coordinated approach, no formal economic evaluation of the REPOP program had been performed. The objective of this study was therefore to assess the cost-effectiveness of the REPOP pediatric obesity management strategy compared with no intervention.
The primary dataset came from the REPPOP cohort study, which followed children with overweight or obesity over a two-year period. This database was used both to simulate the natural history of obesity prior to intervention and to perform the cost-effectiveness analysis. After excluding children with missing data on social difficulties, those followed for more than 3.5 years, and those older than 12 years at inclusion, 553 children remained for analysis. A second data source was a French national study estimating the medical costs associated with obesity, based on the 2002 Health, Health-Care and Insurance Survey (ESPS) linked to the Permanent Sample of Health Insurance Beneficiaries (EPAS), which was used to model long-term efficiency of the REPPOP strategy.
The REPPOP cohort included 553 children aged 6–12 years with complete two-year follow-up data.
Baseline and follow-up variables included age, gender, age at onset of overweight, social difficulties, and BMI Z-scores at inclusion and after two years.
These variables were used to simulate counterfactual BMI trajectories and estimate the program’s incremental cost-effectiveness.
Because no untreated control group was available, a model-based simulation was built to estimate each child’s BMI Z-score trajectory without the REPPOP intervention.
Data were observed at two time points — T₀ (baseline) and T + 2 years — including age, gender, social difficulties, and BMI Z-scores.
A two-step modeling process was applied: 1. The two-year growth rate (X) in BMI Z-score was computed for each child.
2. This growth rate was then modeled using a multiple linear regression, stratified by age group, with predictors: age at onset of overweight, initial BMI Z-score, social difficulties, and gender.
The model can be expressed as:
X_i \;=\; \beta_0 \;+\; \beta_1\,\mathrm{AgeOnset}_i \;+\; \beta_2\,\mathrm{ZBMI}_{i0} \;+\; \beta_3\,\mathrm{Social}_i \;+\; \beta_4\,\mathrm{Gender}_i \;+\; \varepsilon_i, \qquad \varepsilon_i \sim \mathcal N(0,\sigma^{2}).
To incorporate uncertainty, random residuals were drawn from a normal distribution and added to the predicted growth rates, generating individualized simulated Z-scores:
Z_{i,\mathrm{sim}} \;=\; Z_{i,\mathrm{init}} \;+\; X_{i,\mathrm{sim}}.
This approach allowed comparing each child’s observed BMI Z-score trajectory (with REPOP) to their simulated trajectory (without REPPOP).
The cost-effectiveness model was conducted from the payer perspective (French national health insurance). In line with recommendations from the Haute Autorité de Santé (HAS), the therapeutic goal in children is not weight loss but rather stabilization or deceleration of BMI growth.
Accordingly, two measures of effectiveness were used:
a normative criterion — stabilization of BMI Z-score (no increase), and
a quantitative criterion — the cost per one-unit reduction in BMI Z-score over two years.
Only direct medical costs were included in the analysis, covering physician, dietitian, psychologist, and inclusion consultations. All costs were expressed in euros (€) and not discounted, given the short (two-year) time horizon of the REPOP intervention.
The incremental cost-effectiveness ratio (ICER) was computed as the difference in mean costs divided by the difference in mean effects between the REPPOP intervention and the “no-intervention” simulated scenario:
ICER \;=\; \frac{\Delta C}{\Delta E}
where ΔC is the incremental cost and ΔE the incremental effectiveness (reduction in BMI Z-score).
To account for sampling uncertainty, a non-parametric bootstrap method was applied with 10,000 replications. In each bootstrap sample, mean costs and mean effects were recalculated, and the ICER was recomputed. The 95% confidence interval for the ICER was derived using the percentile method, by discarding the lowest and highest 2.5% of simulated ICER values.
This approach is recommended when no strong assumptions can be made regarding the distribution of incremental costs and effects. The resulting bootstrap replications were plotted on the cost-effectiveness (CE) plane, illustrating the joint uncertainty around the incremental cost and incremental effectiveness estimates.
To estimate the long-term cost savings associated with the REPOP intervention, we used data from a French national study that assessed the medical costs attributable to obesity in France. This reference study combined data from the 2002 Health, Health-Care and Insurance Survey (ESPS) and the Permanent Sample of Health Insurance Beneficiaries (EPAS), covering the three main social security schemes. It provided national estimates of annual direct medical costs associated with obesity, used here to extrapolate the future costs avoided through the REPPOP program.
Assumptions were made regarding the percentage of obesity cases prevented by the intervention and the discount rate applied to future costs. We assumed that 16% of obesity cases were avoided among REPPOP participants, and annual costs were discounted at 2% and 4%, consistent with French health-economic guidelines.
The proportion of obesity cases prevented after two years of REPOP care was calculated as:
\text{Obesity Prevented (\%)} \;=\; \frac{N_{\mathrm{obese,\;simulated}} - N_{\mathrm{obese,\;REPOP}}} {N_{\mathrm{obese,\;simulated}}} \times 100
where (N_{}) is the number of children classified as obese at 2 years in the no-intervention (counterfactual) simulation, and (N_{}) is the number observed after REPOP care.
The present value (PV) of avoided obesity-related costs was computed as:
Simple (T-year horizon): PV \;=\; \sum_{t=1}^{T} \frac{p \times C}{(1+r)^{t}}
Age-based (benefits from age (a_s) to (a_e), intervention at age (a_0)): PV \;=\; \sum_{a=a_s}^{a_e-1} \frac{p \times C}{(1+r)^{\,a - a_0}}
with:
(p): proportion of obesity cases prevented (e.g., (16%) () use (p=0.16)),
(C): mean annual direct medical cost of obesity (from the national cost study),
(r): annual discount rate (e.g., (0.02) or (0.04)),
(T): number of years of accrual (simple form),
(a_0): age at intervention start, (a_s): benefit start age, (a_e): benefit end age (age-based form).
This calculation provides an estimate of the discounted long-term cost offsets achieved through the REPOP program, based on its short-term effectiveness in reducing pediatric obesity.
The REPPOP cohort included 553 children (57.7% girls, sex ratio 0.7) with a mean age of 9.4 years (SD = 2.3) and a mean age at onset of overweight of 2.7 years (SD = 1.6). The mean baseline BMI Z-score was 3.34 SD (SD = 0.97); 52.5% of participants were classified as obese and 47.5% as overweight. Overall, 16.6% of children had documented social difficulties. During the two-year program, participants attended on average 5.6 medical, 8.1 psychological, and 8.0 dietary consultations.
In the regression model predicting BMI Z-score growth rate, a one-point increase in BMI Z-score at baseline was associated with a 57% higher estimated growth rate (p < 0.05). For example, among girls aged 2–4 years, with onset of overweight at 3 years and initial BMI Z-score = 1.95 SD, the predicted growth rate was 1.63 [95% CI: 1.01–2.26].
| Variable | Coefficient | Std. Error | p-value |
|---|---|---|---|
| BMI Z-score (age 1) | -0.57 | 0.09 | < 0.001 |
| Male (1 = Yes) | 0.16 | 0.27 | 0.55 |
| Age at onset of overweight | -0.01 | 0.03 | 0.85 |
| Social difficulty (1 = Yes) | 0.11 | 0.32 | 0.71 |
| Constant | 2.66 | 0.29 | < 0.001 |
| N | 196 |
The mean cost per child for the two-year REPOP intervention was €440.51 [414.38 – 466.78]. The intervention produced an average BMI Z-score reduction of 1.6 SD compared with the simulated no-treatment scenario.
The resulting incremental cost-effectiveness ratio (ICER) was:
ICER=€275.3[181.6–402.0] per1 SD reduction in BMI Z-score.
| Resource item | Unit cost (€) | Source |
|---|---|---|
| Medical consultation | 20 | REPOP |
| Psychological consultation | 40 | REPOP |
| Dietetic consultation | 40 | REPOP |
| Inclusion consultation | 60 | REPOP |
A non-parametric bootstrap (10 000 replications) confirmed the stability of the ICER distribution, which was visualized on the cost-effectiveness (CE) plane.
Using national cost-of-obesity data (mean annual medical cost = €506), the discounted cost savings associated with the REPOP intervention were estimated under different scenarios:
| Scenario | Discount rate | Time horizon | Estimated discounted cost savings (€) |
|---|---|---|---|
| Benefits from age 18 to 60 | 2 % | 42 years | 2 933.9 |
| 4 % | 42 years | 2 441.6 | |
| Benefits from age 40 to 60 | 2 % | 20 years | 892.8 |
| 4 % | 20 years | 495.2 |
The proportion of obesity cases that would need to be prevented for the REPOP intervention to be cost-neutral over the 18–60 year period was estimated at 2% (X = 0.02).
knitr::include_graphics("~/Documents/GitHub/Ousmanerabi.github.io/images/bootstrap.png")Ousmane Diallo, MPH-PhD – Biostatistician & Epidemiologist based in [votre localisation]. Specializing in SAS programming, CDISC standards, and real-world evidence for clinical research.
Back to top